This is the place to show off your pictures of the sky, identify clouds, and to discuss how specific cloud types form and what they can tell you about current and future weather.
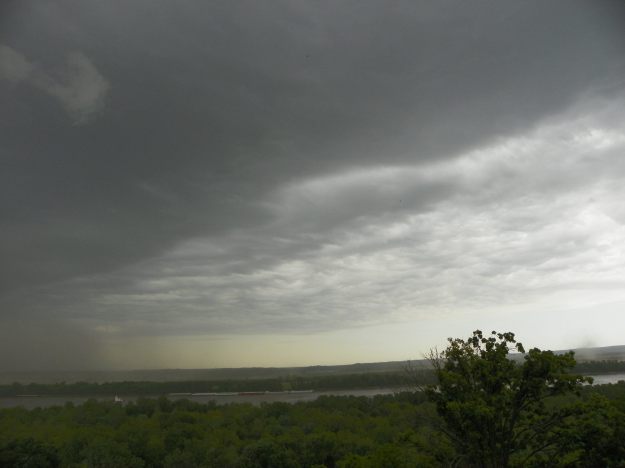
Eileen Lenkman, 7 May 2016, eastern Missouri looking across Mississippi River toward Illinois
On May 7, 2016, a line of storms moved through the midwest. Eileen Lenkman shared a series of photos from eastern Missouri as the storms moved from the NW toward the SE.
In this first photo, the storm can be seen approaching the area.
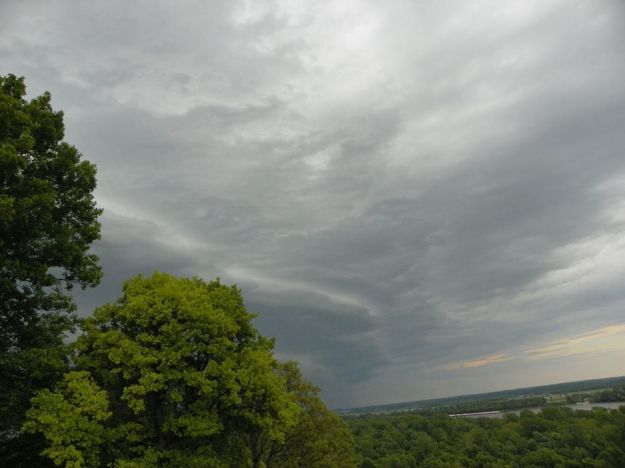
Eileen Lenkman, 7 May 2016, eastern Missouri looking toward Illinois
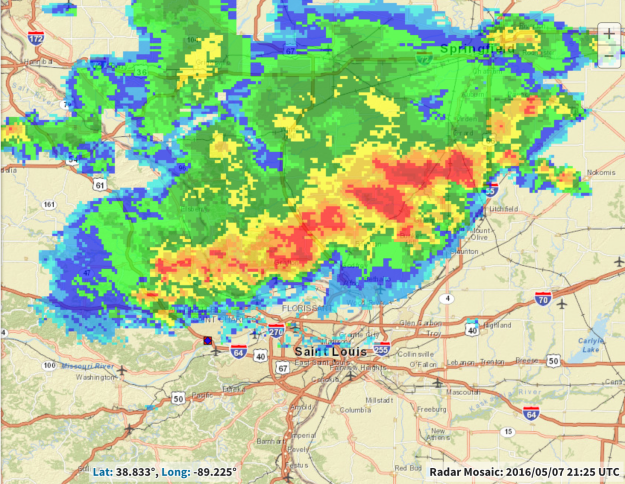
Composite radar imagery at this time shows the extent of this precipitating system as it moves toward the St. Louis area.
In the next photo, the heavily raining portion of the storm appears in Eileen’s view.
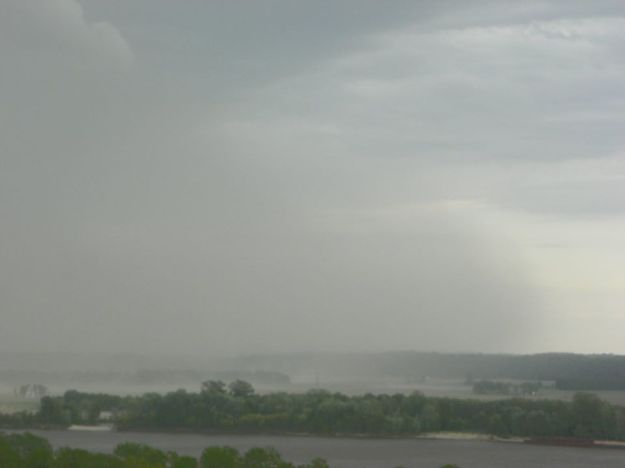
Eileen Lenkman, 7 May 2016, eastern Missouri looking toward Illinois
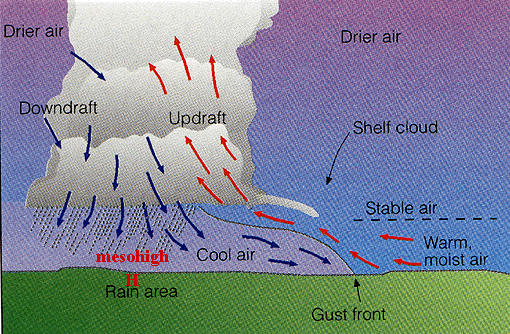
The rain locally cools the air, which spreads out near the ground away from the raining core of the storm. The leading edge of this rain-cooled air is referred to as a gust front and is typically accompanied by strong winds.
Schematic showing the gust front at edge of rain-cooled air
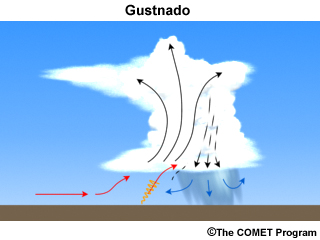
Not only is there a marked temperature distance across the gust front between the rain-cooled air behind it and the warm, moist air ahead, difference in wind speed and direction behind and ahead of the gust front can create considerable horizontal wind shear across that boundary far out ahead of the raining core of the storm. The warm, moist air is lifted up and over the colder dense air behind the gust front. This upward motion can tilt and vertically stretch the small-scale vortices that can form along the edge of the gust front due to the horizontal wind shear, creating a spinning vortex that can extend upward from the ground; this is casually referred to as a “gustnado.”
This shallow, short-lived vortex may only extend upward 10s of feet above the ground with no apparent connection to the cloud above. Away from the raining core, a debris cloud or dust whirl is seen near the surface. Wind speeds can reach 60-80 mph in these gustnadoes, but they are not considered to be a tornado as they are not associated with any sort of parent rotation in the cloud above.
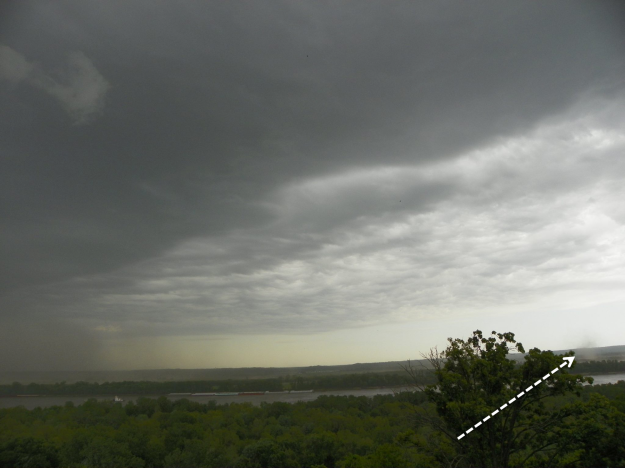
On 7 May 2016, when the storms were moving near St. Louis, Eileen Lenkman captured one of these gustnadoes on camera.
In this photo, the raining core can be seen to the far left of the photo while out to the right the small debris whirl near the surface can be seen at presumably the leading edge of the gust front.
“Well that looks ominous” said Meredith O’Neill Muminovic as she took this photo of an approaching storm on 26 April 2016 in St. Louis, Missouri. The shelf-like appearance of the storm’s leading edge indicates strong winds as rain-cooled air lifts warmer, moist air out ahead of it. At the time of this photo, a Severe Thunderstorm Warning was in effect as 60+ mph winds were reported in the area, as well as hail 1″ in diameter covering the ground in some locations.
The corresponding radar image from around this time shows that the storm Meredith photographed was part of a line of storms moving across Missouri, referred to as a squall line. The red and orange areas in radar reflectivity indicate the heaviest rain, with weaker but widespread rainfall following behind the leading edge. The yellow box around St. Louis indicates the area under the Severe Thunderstorm Warning, which is aligned where the squall line appears bowed.
The bow echo is commonly associated with strong, often damaging winds at the surface. Much research has gone into studying bow echoes, leading us to understand how they form and the resulting weather they cause. The bow structure is strongly related to the wind shear of the environment these storms form in, meaning how the winds change direction and speed with height.
Underneath the storm, turbulent motions are also present, as nicely captured by this video by Billy Reed in St. Louis around the time of Meredith’s photo.
Above, the clouds are deep and, individually, take on the classic structure of a cumulonimbus. In this schematic from the National Weather Service’s online school, JetStream, you can see that where the radar reflectivity shows the heaviest rain with the reds and oranges, the cloud is deep. Warm, moist air flows into the storm from out ahead of the squall line, fueling the strong updraft which hits a stable layer aloft, usually the tropopause, and creating an overshooting top. Within those strong updrafts, large hail can grow as supercooled liquid water freezes upon ice. Smaller Ice crystals can be carried outward to form the anvil of the cumulonimbus or fall and melt behind the updraft, contributing to the heavy rainfall at the surface and lighter rain extending behind the main leading line.
Schematic showing a vertical cross section of the cloud, precipitation, and air motion associated with the radar image of a squall line (from National Weather Service)
The rain cools the air near the surface relative to the surrounding environment. This rain-cooled air rapidly moves outward away from the rainy core. The leading edge of this dense, cool air is referred to as a gust front.
Labeled schematic of a squall line storm from University of Illinois Urbana-Champaign
Warm, moist air that’s flowing in towards the storm is lifted up and over this denser, colder air along the gust front, leading to new cloud formation, and sometimes the shelf cloud that extends outward from the main line of storms, as was shown in Meredith’s picture above.
This multi-cell nature that allows these storms to persist can be seen in this photo from western Oklahoma on this day, when Jack Christian also had his eyes to the sky. The anvil of this series of this multicellular storm over northern Texas extended far across the Plains, with newer cumulus congestus clouds forming in its vicinity. Notice the tilt in these cumulus congestus clouds, as the strong wind shear indicates increasing winds with height, but turning in direction from the tops of these clouds to the top of the cumulonimbus as the anvil spreads out in the other direction.
Cumulonimbus, Multicell, Jack Christian, Elk City, Oklahoma, 26 Apr 2016 5 PM CDT
So we’ve taken a good look at these storms from below, but what about above? Matt Barto was flying over Oklahoma later that afternoon and was treated to this spectacular view of the storms from above. Look at the classic structure of this cumulonimbus, with the anvil spreading outward from the bubbling core.
Cumulonimbus, Matt Barto, over Oklahoma 26 Apr 2016
We live in the era where 1-min visible satellite data is available and it’s incredibly valuable for looking at the evolution of these storms. Here’s a 30-min loop showing the storms over Oklahoma and Texas where you can see the bubbling nature of the individual clouds, with the overshooting tops clearly visible, the anvils spreading outward, and gravity waves resulting from the displacement of mass in the atmosphere by these massive storms.
GOES 14, 1-min Visible Sector 26 April 2016 2220- 2250 UTC
At the end of the day, not only where there very strong wind reports (blue dots) from the squall lines, but over 30 reports of tornadoes (red) and hundreds of reports of hail (green) including some baseball-sized.
26 April 2016 Severe Reports
Did you experience severe weather this day? We’d like to hear your story and see your cloud photos.
In our last blog post (https://communitycloudatlas.wordpress.com/2015/04/03/kicking-off-a-stormy-u-s-spring/), we shared some photos from the stormy start of the severe weather season in the central U.S. (24 March 2015). Large cumulonimbus grew over portions of Oklahoma, Arkansas, and Missouri, producing large hail in some locations. On the next day (25 March 2015), another round of severe weather would bring the first reports of tornadoes for the year.
There has already been an excellent summary created for this event that describes the atmospheric conditions and storm timeline: http://www.ustornadoes.com/2015/03/27/the-science-behind-the-oklahoma-and-arkansas-tornadoes-of-march-25-2015/
Earlier in the day, before the storms formed, mammatus clouds were observed over the National Weather Center in Norman, Oklahoma. Dena Grose shared with us her excellent photo, showing these bulbous clouds that can form when the air is much drier below the cloud deck.
Dena Grose, Norman, Oklahoma, 25 March 2015 (2 PM CDT)
While there were severe storms later in the day, these mammatus were not associated with any storms. This is confirmed by looking at the corresponding radar image from this time.
As time went on, a cold front provided the necessary lift to produce storms later in the evening. Matt Wing shared with us a picture of mammatus clouds, this time over Tulsa just prior to when a tornado warning was issued. In this case, the mammatus were indeed associated with severe storms.
Matt Wing, Tulsa, OK, 25 Mar 2015
Post-storm damage surveys indicated several tornadoes that moved through the Tulsa area. The strongest tornado was an EF-2 reported in nearby Sand Springs. Here’s a summary of the damage survey from the National Weather Service.
While Oklahoma experienced the worst of these storms, this unsettled weather provided beautiful views of turbulent skies over nearby regions. Shauna West sent us this picture from Pittsburg, Kansas.
Shauna West, Pittsburg, Kansas, 25 Mar 2015
Further south, over Arlington, Texas, Whitney Coker Terrell shared her turbulent view beneath a storm that same evening.
Whitney Coker Terrell, Arlington, Texas, 25 Mar 2015
Spring in the northern hemisphere means severe weather for much of the U.S. While this year was off to a slow start in terms of tornado reports, there were several days of severe weather reported last week. During this time of year, the necessary ingredients for severe storms come together in the central and southern part of the U.S. These ingredients include warm moist air from the Gulf of Mexico, which are commonly separated from the warm dry air from the southwest U.S. by what we call a dry line. This boundary can be seen on radar as a thin line and can be identified on surface observations by looking at where the warm moist air from the south/southeast is separated from the warm dry air coming from the southwest. Here is an example of the dry line from March 24, 2015; the first day of active weather last week. You can see the faint blue line in the radar image as well as a computer-generated yellow line on the surface map that indicates the dry line. Notice that temperatures are similar (in the 70s and 80s) on either side of the line, while to the west of the line, dewpoint temperatures (a measure of the amount of moisture in the air) are in the 20s and 30s, while 60+ degree Fahrenheit dewpoints to the east of the line indicate moist air. Surface air ahead of the dry line may be warm and moist, but cooler, drier air above that usually comes from the west, forming what is called a “cap.” This means that the warm air is limited in how far it can lift so something needs to push the air upward above that cap so it can reach its level of condensation. At that point, it can tap into the energy available and grow into an impressive thunderstorm. Balloons are launched twice a day, sometimes more if severe weather is expected. These balloons measure temperature, moisture, wind, and pressure. Here is an example of the data from one of these “soundings” from southwest Missouri during a time before the dry line passed through. The lift that’s needed to break through this cap can come from the dry line. That’s why you typically see storms developing along this boundary. Storms that develop along the boundary can displace the air above it, creating what are called gravity waves. This is similar to the way that ripples disperse from the spot on the water surface where you throw a rock. In the sky, the air wants to go up, but if the air is stable (as it is out ahead of the dry line in certain layers of the atmosphere), gravity will pull the air back toward the ground, creating ripples in the sky. Where the air is rising, assuming it’s moist enough, clouds will form. On this day that we’re discussing (March 24, 2015), Karl Kischel noticed some of these gravity wave clouds over Cuba, Missouri at around 3:30 PM CDT.
Karl Kischel, Cuba, Missouri, 24 Mar 2015, 330 PM (CDT)
Because Karl gave us the exact time and location, we were able to go back and look at the corresponding satellite imagery, where you can clearly see the extent of these clouds. The infrared satellite image gives us a sense of the temperature of the cloud tops, where the warmer colors mean warm temperatures and therefore at lower levels. Notice how these wave clouds are lower in the atmosphere than the deep thunderstorms that create the waves downstream. Storms continue to fire off this dry line as it moved eastward. Radar imagery shows this line of storms along the boundary, extending from Missouri down into Oklahoma and Arkansas. Matt Wing was with friends in Huntsville, Arkansas and captured an incredible view of one of these storms. This picture showcases the characteristic anvil of the beautiful cumulonimbus cloud.
Matt Wing, Huntsville, Arkansas, 24 Mar 2015
The bubbly characteristic of the middle of the storm indicates turrets of upward motion. The upward motion in these storms can be strong enough to support increasingly larger ice that can fall as hail. Indeed, storm reports on this day showed hail with diameters reaching 1-2″. As the sun was setting, David Holland was in Oklahoma City, looking at distant storms to the east.
David Holland, Oklahoma City, 24 Mar 2015
He captured the beautiful cumulonimbus in the distance, with a curious section of cloud above the anvil. We suspect this is an overshooting top that has eroded with time. An overshooting top is a cloud directly above the updraft that penetrates through the stable layer where the anvil is seen. When the sun is shining at a low angle (like at sunset), the visible satellite can pick up on these overshooting tops, as is pointed out in this image.
After a relatively cool summer, hot humid conditions have prevailed in the Mid-Atlantic and Northeast of the U.S. in the past week. Today, in particular, featured hot, humid conditions, providing fuel for storms. A system passed over the region, providing the necessary lift to get these storms going. The result was a long line of storms moving through Maryland, producing heavy rain, lightning, and damaging winds. Multiple people shared their view of the storm, both during and after, which is displayed on this map showing their corresponding location for each picture.
Overlay of pictures on map of MD. Times vary.
The two pictures in western MD were taken following the passage of the storm. The radar image below roughly corresponds to times of these pictures. You can see a north-south oriented line of reds, indicating heavy rain, that had just passed through.
Radar image from 4:46 EDT, showing line of storms passing through Washington County, MD
Let’s take a closer look at the pictures from this time. While the overall sky remained covered in cloud, a key feature in both of these photos are the lower level clouds hanging beneath. These are referred to as fractus and form in the moist environment that remains after the rain has passed.
Photo courtesy of Nancy Kirkpatrick in Cascade, MD (2 Sept 2014, after storm passed) showing fractus clouds.
Photo after the storm passed showing lower residual clouds in Smithsburg, MD (Debbie Rowe, 2 Sept 2014)
Another view from Debbie Rowe of the back edge of the storm.
This line of storm continued its path across Maryland throughout the evening. The radar image below shows that hours later, it maintained a linear structure on the other side of the state. Also notice storms developing over northern VA at this time; a focus for the next picture.
Radar image from 6:43 EDT
This new cluster of storms, forming in a similar environment as the earlier round, later went on to also organize into a linear structure. In this later radar image, you can see this structure, the reds indicating heavy rain, and a line of lighter blues out ahead. This latter feature is what we call an outflow boundary, and indicates strong, cold winds moving out ahead of the storm, lifting up warm, moist air ahead of it along with any dust, insects, etc. in its path. (Check out our previous post to learn more about this outflow.)
Radar image from 7:27 EDT. White arrow shows location of outflow boundary.
Notice at this time, the leading edge of this storm is moving over Washington, D.C. Jen Horneman was driving just outside the city at this time and snapped this photo out the window (the third picture in the map above). A close-up view reveals a much lower cloud base as the warm moist air being lifted along the outflow cools and condenses to form this menacing, low cloud. Strong winds were expected with this feature, followed by heavy rain.
Photo courtesy of Jen Horneman near Arlington, VA
After these storms moved through, in addition to the heavy rain indicated by the oranges and reds in the radar image, damaging winds were associated with these storms. Many reports indicated large trees down throughout the state.
Severe weather reports from the Storm Prediction Center. Blues indicate severe winds.
Were you affected by these storms? Feel free to share with us any pictures or stories you may have!
Pyrocumulonimbus in Wood Buffalo National Park, Canada (Photo by Mike Smith at 1400 MDT on 5 Aug 2014)
Pyrocumulonimbus in Wood Buffalo National Park, Canada (Photo by Mike Smith at 1400 MDT on 5 Aug 2014)
For those of us in the U.S., we’ve been hearing a lot about the wildfires burning in the west, from California up through eastern Washington. But areas of Canada have also seen a devastating fire season. In fact, it has been one of their worst in recorded history with 354 fires so far this year in the Northwest Territories, burning over 2.8 million hectares (Source: Northwest Territories Environment and Natural Resources, Forest Management Division).
Mike Smith is a meteorologist with the Yukon Wildland Fire Management and has been offering on-site support for wildfires. He took these pictures on August 5 of a fire that started in the northwest portion of Wood Buffalo National Park and grew rapidly during August 3-5. To get ourselves oriented, here is a map showing where this park is located.
Location of Wood Buffalo National Park
This particular fire, given the identifier 14WB-025, is one of many in this park on that day. This map from the Forest Fire Management Program shows the location of this fire in the northwest corner of the park, near Buffalo Lake; one noted as being managed.
To put this fire in context of other fires in the greater region, this map, provided by the Canadian Wildland Fire Information System, shows fire “hotspots.” These are satellite pixels that indicate burning vegetation and may indicate one fire or several hot spots within a larger fire. You can see the high concentration of these hot spots in the Northwest Territories on the day the picture was taken, and this may even be underestimating hotspots if there was cloud cover involved.
Fire “hotspots” derived from satellite infrared data. Courtesy of the Canadian Wildfire Information System.
Speaking of clouds, which is the purpose of this post, the heat from the fire rises rapidly into the atmosphere and cools, leading to condensation of water vapor to form cloud droplets. This heat typically produces even more intense upward motion than just the sun heating the ground on a warm summer day, and the ash/smoke in the air gives the clouds a darker appearance and can serve as nuclei for water droplets and ice crystals to form on. These storms can become so intense that they can produce rain and lightning; therefore technically being called “pyrocumulonimbus” clouds.
Luckily in this case, rainfall from this and other storms moving through helped to stall the growth as fire crews were protecting structures in a small community near the fire. Mike and the fire crews have been working hard to protect lives and property and deserve a huge thanks.
As if this pyrocumulonimbus cloud wasn’t impressive enough from the ground, the Moderate Resolution Imaging Spectroradiometer (MODIS) aboard the Aqua satellite passed over this location around that same time (20:20 UTC or 14:20 MDT), offering an incredible perspective of this cloud from above. Wow!
Richard Barnhill, View from Washington, D.C. on August 3, 2014
Ah, thunderstorms. A typical sight in the summer months where warm moist air rises in unstable environments to produce heavy rain, lightning, and beautiful views. On Sunday, moist onshore flow from the Atlantic impacted the eastern seaboard of the U.S. while a series of disturbances in the atmosphere provided the lift to create scattered storms.
Up close, these storms present an ominous sky, with dark clouds moving overhead. Storms were in the vicinity of D.C. this day, and you can see their threatening undersides near the top of this photo. But looking out beyond these nearby storms, you can see others in the distance. To the far right, there’s the characteristic puffy tops of growing cumulus clouds. To the left in the far distance, a more mature storm can be seen.
So how far away was that storm in the distance? Well, Richard Barnhill not only captured this photo, but also a screen shot of the current radar at this time. You can see where this storm was relatively to D.C., nearly 75 nautical miles (140 kilometers) away.
Looking back at the picture of this distant storm, notice how the top of it seems to spread out horizontally like an anvil. Need a refresher on what we mean by an anvil? Well, here you go:
As the storm grows in the atmosphere, it is limited by how high it can reach by how the temperature of the surrounding environment changes with height. In the troposphere, where most of our weather occurs, temperature tends to decrease as you go higher in the atmosphere. Certain conditions can lead to levels where temperature begins to increase with height, called an inversion, which serves as a sort of “lid” for these storms. The most common lid in the atmosphere is at the top of the troposphere, where above that temperature begins to increase with height in the stratosphere. So a storm can tap into the energy available in the troposphere as long as it remains warmer than its environment and can continue to rise until this equilibrium level. Here’s a handy diagram that can help show what we mean by this.
The take-home message from this image is that once the cumulonimbus reaches that stable point, the ice crystals in the upper-levels of the storm will begin to spread out horizontally in the stronger upper-level winds, creating the anvil. This type of cumulonimbus, that has the characteristic anvil, is called the “incus” variety. Incus is another name for “anvil” and is not only used to describe these clouds, but is also the name for a part of our ear.
See the “incus” in the middle part of the ear
Zoomed in on the parts of the “incus” of our ear
For those who regularly follow our page, notice another familiar term that’s used to describe clouds?
So the distant anvil of Richard’s picture is an indicator of a more mature storm that has reached its maximum vertical growth. The clouds overhead were not posing an immediate threat, but shortly after, more intense storms rolled through the region.
Shawn Burke
Location: Ocean Springs, Mississippi
Date: 9 July 2014
High amounts of moisture available in the atmosphere combined with slow moving storms created a recipe for periods of heavy downpours near the Gulf Coast of Mississippi on 9 July. You can see the high-intensity rain shaft in this picture from Shawn, revealing an area of strong downward motion. This rain-cooled, downward air spreads outward away from the storm, lifting warm moist air out ahead of it. This can lead to new storm formation in nearby areas, which is a common scenario for flash flooding events.
These two radar images (separated 45 minutes apart) provide a view of these storms and the interaction the outflow they produce. Note that a line of storms form along the intersection of two boundaries (seen as fine lines of greens/blues on radar). These storms merge and intensify to produce an outflow boundary of their own, which can go on to produce new storms, and so on.
Just because rain is produced in a cloud, doesn’t mean the precipitation will reach the ground. This is referred to as “virga” and this evaporation cools the air (the same reason you feel chilly when getting out of the shower), leading to strong downward motion because cold air is denser. This can result in periods of gusty winds and if the storm also produces lightning on a hot day, could create a serious fire threat in this dry environment.
This morning, in Elko, NV, a ballon was launched from the local National Weather Service office (as is done both morning and evening every day) that carries instruments to measure temperature, moisture, pressure, and winds in the atmosphere. The diagram below shows what this data looks like, with the red line showing temperature decreasing as you go up in the atmosphere and dewpoint temperature (a measure of the amount of moisture in the air) shown in green. The difference between the temperature and dewpoint is the humidity so the farther apart they are, the drier the atmosphere. This morning, you can see that there were some nearly saturated conditions in the mid-levels (where the green and red are closest) while below, near the surface, the lines are far apart indicating very dry conditions.
Brian Boyd sent us the following picture early this afternoon from near Elko, showing the cumulus clouds that were forming. The temperature at this time, according to Brian, was 95 degrees (Fahrenheit) with a relatively humidity of 9%; consistent with the dry atmosphere that was observed in the balloon data (called a sounding) earlier that morning. The heat from the sun was enough to create lift as the warm surface air rose and cooled to produce clouds at the level where the temperature dropped to the dewpoint.
Brian Boyd
Location: Elko, NV
Date: 2 July 2014
Nearly an hour later, from essentially the same view, Brian sent us another photo that showed that these clouds had increased in coverage, appearing darker and, as Brian told us, produced lightning.
Brian Boyd
Location: Elko, NV
Date: 2 July 2014
If we take a look at the visible satellite image from around this time (2245 UTC), you can see these clouds scattered across much of northeastern Nevada.
Now, if we take a look at the Elko radar data from this same time (but over a smaller area), you can see backscatter power returned from the raindrops in these growing cumulonimbus clouds near Elko (the blues, greens, and yellows).
Despite seeing what looks like precipitation on radar, if you look back at Brian’s second photo, and based on his observations, there wasn’t actually rain hitting the ground. It was evaporating in that very dry air below. That, combined with the lightning he observed, posed a serious fire threat for this region. Add to that the gusty winds due to the evaporative cooling, and you can see why this could be a concern.
Speaking of gusty winds and virga, we saw a video recorded yesterday south of Elko from the National Weather Service office in Reno, NV, a place also characterized by dry, hot low-levels recently and evaporating rainfall. In this video, you’ll also see the clouds building and, towards the end, you’ll see the “microburst” as strong winds hit the surface resulting from strong downward motion due to the evaporative cooling. Because there was no rain at the surface, this is referred to as a dry microburst.
Tom Rickenbach
Location: Darwin, Australia
Date: January 1989
The cumulonimbus cloud is what we commonly call a thunderstorm, characterized by rumbling thunder and electrifying displays of light. These storms can be isolated or as part of a larger group of storms, at times bringing periods of heavy rain followed by longer periods of lighter persistent rainfall. Radar is one tool to look inside the clouds to study the formation of rainfall, and instruments are also available to measure the electricity in clouds. Put these together and an understanding of how processes in the storm lead to lightning production in a variety of storm types and sizes can be investigated.
Darwin, Australia is a great location to study this range of storms, especially during the wet, monsoon season when there are both intense individual storms and large clusters of storms (what we refer to as mesoscale convective systems). While there have been several scientific studies in the region, these pictures are from one particular project in 1989 called The Down Under Doppler and Electricity Experiment, or DUNDEE for short (clever name for a project in Australia, right?). Using radars (the protective radome of the MIT radar can be seen in the second photo), surface and upper-air measurements, and instruments to measure electrical activity, this study allowed for valuable insight into the characteristics of these various storms, how they relate to environmental conditions, and the relationship between lightning and microphysical processes inside the storm (such as formation of ice, collision of ice, rainfall production, etc.). This diagram shows where the lightning sensors were located during this project (courtesy of Rutledge, S.A., E.R. Williams, and T.D. Keenan, 1992: The Down Under Doppler and Electricity Experiment (DUNDEE): Overview and preliminary results.Bull. Amer. Meteor. Soc., 73, 3-16):
There are many types of lightning, from the cloud-to-ground (CG) strokes seen in the first photo to the intra-cloud (IC) lightning that appears to be crawling across the cloud. Collisions of smaller ice crystals and large, precipitation-sized ice (such as graupel and hail) lead to charge separations in the cloud. The discharge of electricity can occur between different layers of charge within the cloud, between the cloud and the ground, between different clouds, and between the cloud and the air. Always seeking the path of least resistance, many step leaders can be seen in addition to the main stroke, creating an incredible display of light.