This is the place to show off your pictures of the sky, identify clouds, and to discuss how specific cloud types form and what they can tell you about current and future weather.
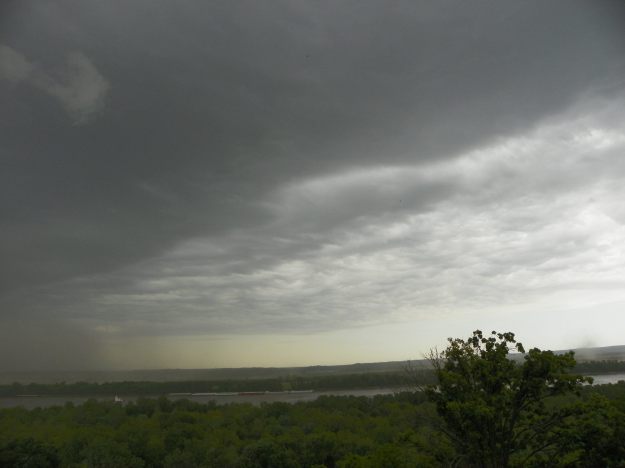
Eileen Lenkman, 7 May 2016, eastern Missouri looking across Mississippi River toward Illinois
On May 7, 2016, a line of storms moved through the midwest. Eileen Lenkman shared a series of photos from eastern Missouri as the storms moved from the NW toward the SE.
In this first photo, the storm can be seen approaching the area.
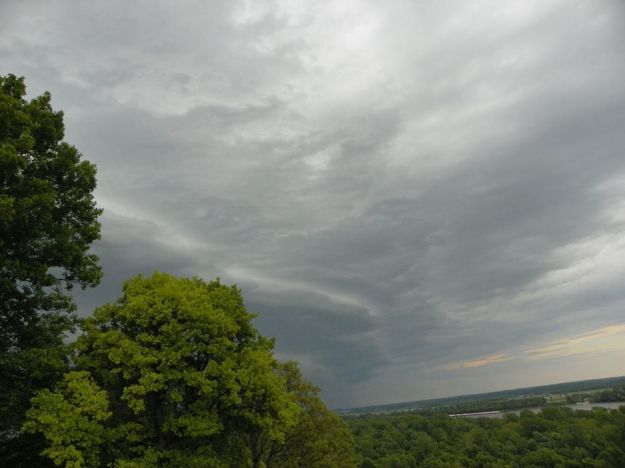
Eileen Lenkman, 7 May 2016, eastern Missouri looking toward Illinois
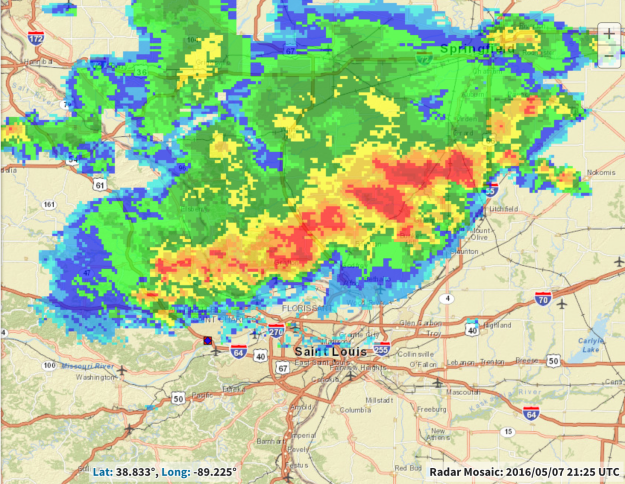
Composite radar imagery at this time shows the extent of this precipitating system as it moves toward the St. Louis area.
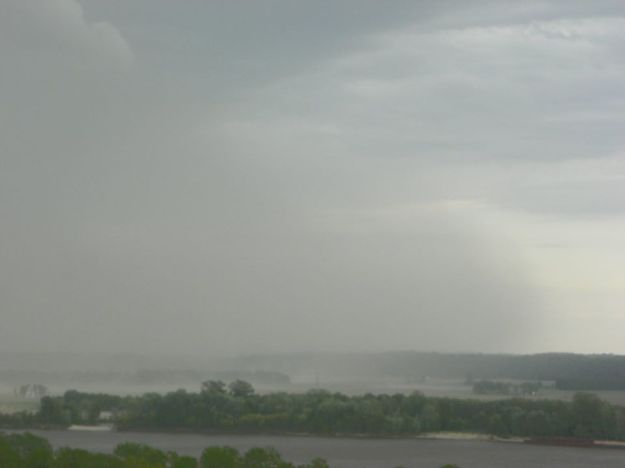
In the next photo, the heavily raining portion of the storm appears in Eileen’s view.
Eileen Lenkman, 7 May 2016, eastern Missouri looking toward Illinois
The rain locally cools the air, which spreads out near the ground away from the raining core of the storm. The leading edge of this rain-cooled air is referred to as a gust front and is typically accompanied by strong winds.
Schematic showing the gust front at edge of rain-cooled air
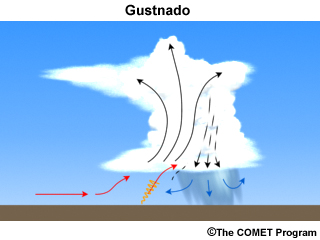
Not only is there a marked temperature distance across the gust front between the rain-cooled air behind it and the warm, moist air ahead, difference in wind speed and direction behind and ahead of the gust front can create considerable horizontal wind shear across that boundary far out ahead of the raining core of the storm. The warm, moist air is lifted up and over the colder dense air behind the gust front. This upward motion can tilt and vertically stretch the small-scale vortices that can form along the edge of the gust front due to the horizontal wind shear, creating a spinning vortex that can extend upward from the ground; this is casually referred to as a “gustnado.”
This shallow, short-lived vortex may only extend upward 10s of feet above the ground with no apparent connection to the cloud above. Away from the raining core, a debris cloud or dust whirl is seen near the surface. Wind speeds can reach 60-80 mph in these gustnadoes, but they are not considered to be a tornado as they are not associated with any sort of parent rotation in the cloud above.
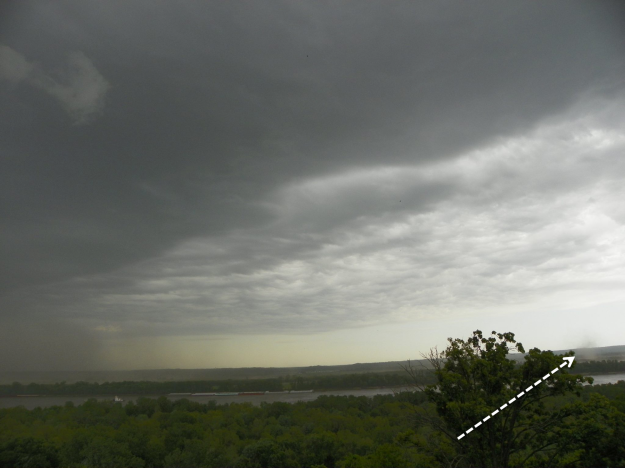
On 7 May 2016, when the storms were moving near St. Louis, Eileen Lenkman captured one of these gustnadoes on camera.
In this photo, the raining core can be seen to the far left of the photo while out to the right the small debris whirl near the surface can be seen at presumably the leading edge of the gust front.
“Well that looks ominous” said Meredith O’Neill Muminovic as she took this photo of an approaching storm on 26 April 2016 in St. Louis, Missouri. The shelf-like appearance of the storm’s leading edge indicates strong winds as rain-cooled air lifts warmer, moist air out ahead of it. At the time of this photo, a Severe Thunderstorm Warning was in effect as 60+ mph winds were reported in the area, as well as hail 1″ in diameter covering the ground in some locations.
The corresponding radar image from around this time shows that the storm Meredith photographed was part of a line of storms moving across Missouri, referred to as a squall line. The red and orange areas in radar reflectivity indicate the heaviest rain, with weaker but widespread rainfall following behind the leading edge. The yellow box around St. Louis indicates the area under the Severe Thunderstorm Warning, which is aligned where the squall line appears bowed.
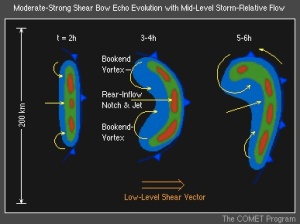
The bow echo is commonly associated with strong, often damaging winds at the surface. Much research has gone into studying bow echoes, leading us to understand how they form and the resulting weather they cause. The bow structure is strongly related to the wind shear of the environment these storms form in, meaning how the winds change direction and speed with height.
Underneath the storm, turbulent motions are also present, as nicely captured by this video by Billy Reed in St. Louis around the time of Meredith’s photo.
Above, the clouds are deep and, individually, take on the classic structure of a cumulonimbus. In this schematic from the National Weather Service’s online school, JetStream, you can see that where the radar reflectivity shows the heaviest rain with the reds and oranges, the cloud is deep. Warm, moist air flows into the storm from out ahead of the squall line, fueling the strong updraft which hits a stable layer aloft, usually the tropopause, and creating an overshooting top. Within those strong updrafts, large hail can grow as supercooled liquid water freezes upon ice. Smaller Ice crystals can be carried outward to form the anvil of the cumulonimbus or fall and melt behind the updraft, contributing to the heavy rainfall at the surface and lighter rain extending behind the main leading line.
Schematic showing a vertical cross section of the cloud, precipitation, and air motion associated with the radar image of a squall line (from National Weather Service)
The rain cools the air near the surface relative to the surrounding environment. This rain-cooled air rapidly moves outward away from the rainy core. The leading edge of this dense, cool air is referred to as a gust front.
Labeled schematic of a squall line storm from University of Illinois Urbana-Champaign
Warm, moist air that’s flowing in towards the storm is lifted up and over this denser, colder air along the gust front, leading to new cloud formation, and sometimes the shelf cloud that extends outward from the main line of storms, as was shown in Meredith’s picture above.
This multi-cell nature that allows these storms to persist can be seen in this photo from western Oklahoma on this day, when Jack Christian also had his eyes to the sky. The anvil of this series of this multicellular storm over northern Texas extended far across the Plains, with newer cumulus congestus clouds forming in its vicinity. Notice the tilt in these cumulus congestus clouds, as the strong wind shear indicates increasing winds with height, but turning in direction from the tops of these clouds to the top of the cumulonimbus as the anvil spreads out in the other direction.
Cumulonimbus, Multicell, Jack Christian, Elk City, Oklahoma, 26 Apr 2016 5 PM CDT
So we’ve taken a good look at these storms from below, but what about above? Matt Barto was flying over Oklahoma later that afternoon and was treated to this spectacular view of the storms from above. Look at the classic structure of this cumulonimbus, with the anvil spreading outward from the bubbling core.
Cumulonimbus, Matt Barto, over Oklahoma 26 Apr 2016
We live in the era where 1-min visible satellite data is available and it’s incredibly valuable for looking at the evolution of these storms. Here’s a 30-min loop showing the storms over Oklahoma and Texas where you can see the bubbling nature of the individual clouds, with the overshooting tops clearly visible, the anvils spreading outward, and gravity waves resulting from the displacement of mass in the atmosphere by these massive storms.
GOES 14, 1-min Visible Sector 26 April 2016 2220- 2250 UTC
At the end of the day, not only where there very strong wind reports (blue dots) from the squall lines, but over 30 reports of tornadoes (red) and hundreds of reports of hail (green) including some baseball-sized.
26 April 2016 Severe Reports
Did you experience severe weather this day? We’d like to hear your story and see your cloud photos.
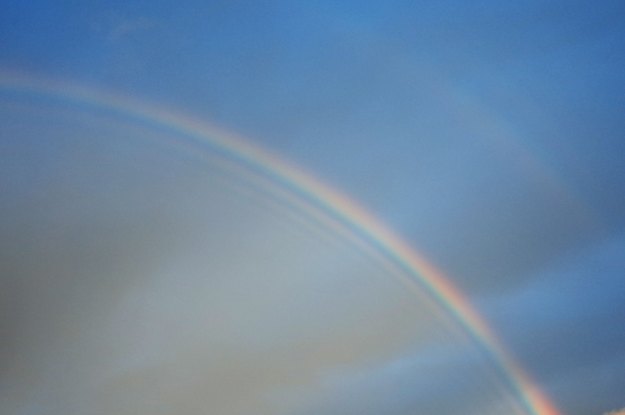
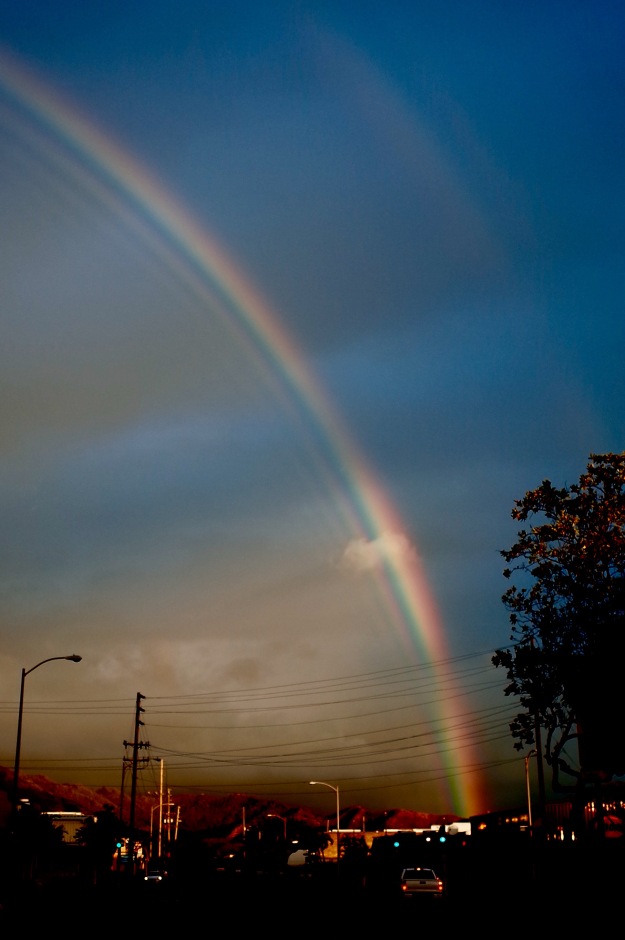
Primary rainbow with supernumerary bows and a faint secondary bow. Photo from Noboru Chikira, 21 Apr 2016, Oahu, Hawaii.
No, your vision isn’t blurred. There are actually additional colored bands bordering the bright primary rainbow in this picture from the Hawaiian Island of Oahu. These faint, pastel bands of light are referred to as supernumerary bows. “Supernumerary” means “more numerous” and is an adjective used not only for describing this optical phenomenon, but also for everything from teeth to military officers. To understand how these bands form, we first need to consider what creates a rainbow in the first place.
Rain showers over the tropical Hawaiian Islands, and elsewhere, can lead to vibrant rainbows. How does this occur? First, consider the energy emitted by the sun, which includes waves of energy in the UV, infrared, and visible portions of the electromagnetic spectrum. Most of the sun’s energy is emitted as visible light, which includes a range of colors (ROYGBIV).
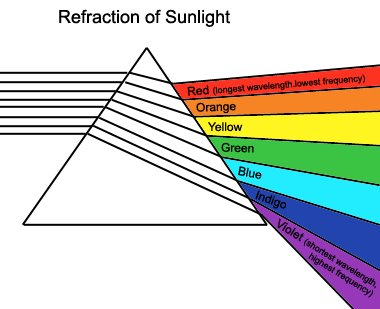
In 1665 Isaac Newton, through his infamous prism experiment, was able to prove that the white light of the sun was actually composed of a color spectrum. The sun’s visible light entered the prism and was refracted (bent) through the prism, with the red (longest wavelength) bending the least and the shorter wavelength violet bending the most.
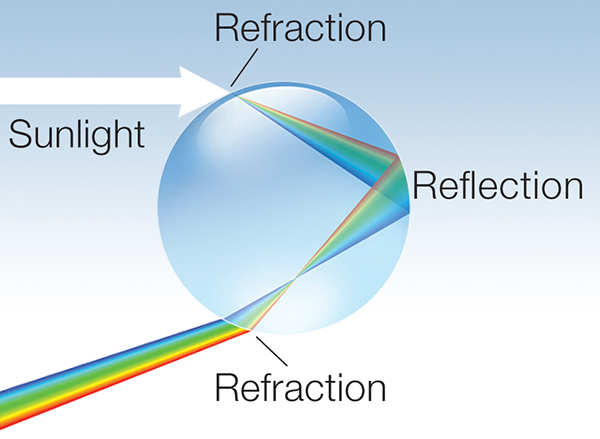
A raindrop falling from a cloud can act as a prism, bending and reflecting the light to produce the colors of the rainbow. When the sunlight encounters a raindrop, some of the light is bent as it enters the drop. This refracted light hits the back of the raindrop, is reflected internally within the drop, then is bent (refracted) once again as it exits the drop.
Because the different colors of the sunlight bends at different angles, the result of one internal reflection means the primary rainbow will have red on the outside and blue on the inside. This process happens to an assortment of raindrops falling from the sky leading to the existence of many rainbows at the same time; however, which one you see (and how much of one you see) depends on your viewpoint relative to the angle of the sun above the horizon behind you.
Sometimes, a second, fainter rainbow can be seen in the sky. This secondary rainbow results from two internal reflections (instead of one) inside the raindrop, leading to the colors appearing in the opposite order as the primary bow. In the following picture, you can see the faint secondary bow in the upper right.
Primary rainbow with supernumerary bows and a faint secondary bow. Photo from Noboru Chikira, 21 Apr 2016, Oahu, Hawaii.
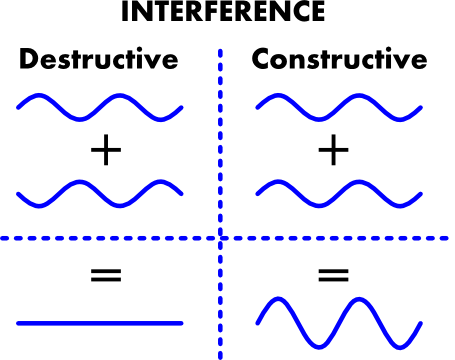
The key to the formation of rainbows, is therefore dependent on the sunlight, raindrops, and how much and how many times the sunlight bends and reflects within the drop. To understand supernumerary bows, the feature of this post, it’s important to remember that rays of light are waves of energy. Think of the ripples and waves that form on a water surface and what happens when they interact with each other. Some can counteract and destroy each other, while others can join to make a bigger wave. A similar description can be applied to waves of light.
The distance between the crests of these waves of energy is referred to as the wavelength (recall red light has a longer wavelength than blue).
If the waves are in sync with each other, they can constructively interfere to amplify the wave. If they are out of sync (out of phase) with each other, they can destructively interfere to cancel each other out.
So with this in mind, given the different angles of refraction for the different colors of the sun’s rays when sunlight encounters and is bent through and around a raindrop, there is bright light where the crests of waves are aligned (and therefore constructively interfere); similarly, there is darkness where the waves of light destructively interfere. Each of the bright fringes is a supernumerary bow, created by interference between different portions (colors) of the same light wave.
Why can’t we always see supernumerary bows? Well, their presence depends on the size of the raindrops. Supernumerary bows can only be seen when the sunlight encounters small raindrops that are all nearly the same size. In a typical rain storm, there are drops falling of many different shapes and sizes, which would wash out the colors of the supernumerary bows. Basically each differently sized raindrop would produce differently spaced, overlapping fringes that would blur. There is a sweet spot, though, because as the drops become even smaller, the bow broadens, the colors become less saturated, and eventually there is no longer a vibrant rainbow but a faint cloudbow or fogbow. An excellent description of these bows and their dependence on drop size can be found here: http://www.atoptics.co.uk/rainbows/supdrsz.htm
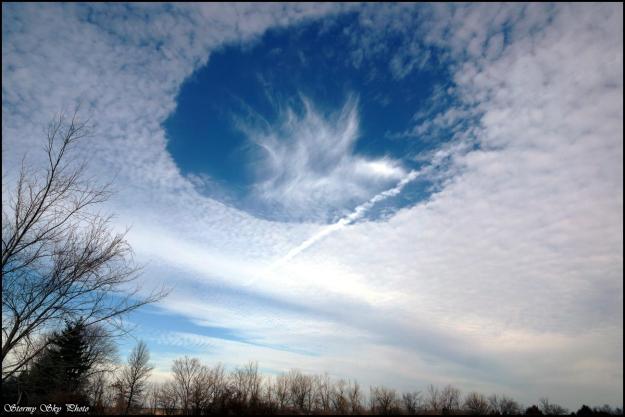
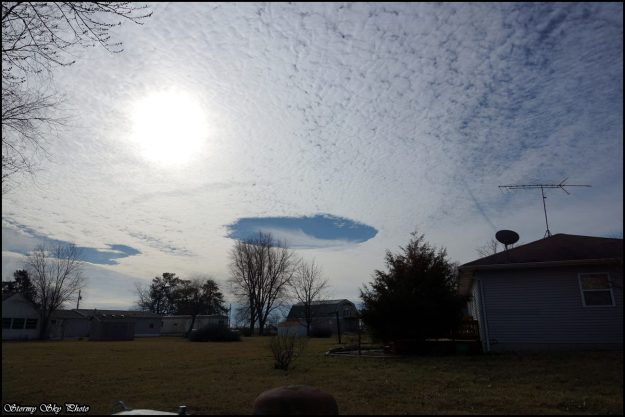
Hole punch clouds have fascinated sky watchers, scientists, and pilots since the 1940s. Nearly circular in appearance, the hole punch cloud can have streams of ice falling from its center (as in Karl’s picture), thereby giving a subset of these clouds the name fallstreak holes. These beautiful, fascinating atmospheric phenomena are created by aircraft penetrating cloud layer. In Williamsburg, it’s not unlikely to see planes ascending and descending due to the nearby busy St. Louis airport.
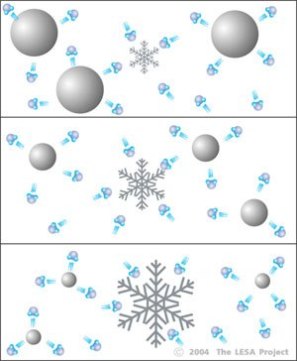
Fallstreak holes require a specific cloud type: mid-level altostratus or altocumulus clouds that exist between 6,500 and 20,000 ft above ground. At these altitudes, temperatures are well below freezing, but water droplets exist in liquid form at these sub-freezing temperatures, called supercooled water. To freeze, liquid water droplets need either a nucleus to freeze upon (either ice itself or a particle in the air such as dust, bacteria, fungal spores, volcanic ask, etc.) or temperatures to be below -40 degrees C to freeze spontaneously without a nucleus.
So how does an aircraft flying through supercooled water lead to freezing of drops and ultimately a fallstreak hole? We know that when aircraft fly high in the sky, at very cold temperatures (i.e., below -40 degree C), the water vapor in the jet engine exhaust rapidly freezes to form contrails across the sky, as can be seen in the photo above. But the key for fallstreak holes is the localized cooling that’s created around propellors and wings. Propellors push air outwards, causing the air to expand, which lowers the pressure and therefore cools the air. For jets, lower pressure exists above the wing compare to below, again leading to localized cooling of the air. This can cool the air to temperatures below -40 degree C, even when the aircraft is flying at lower temperatures, causing the supercooled water droplets in the cloud layer to spontaneously freeze where the aircraft passes through.
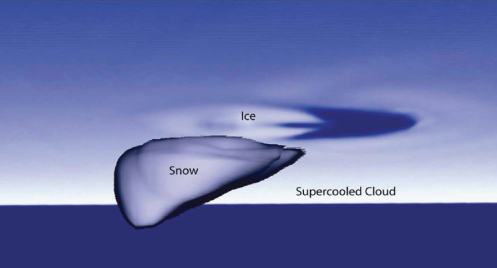
These ice crystals begin to grow at the expense of the nearby supercooled droplets, referred to as the Bergeron-Findeisen process. The vapor left behind by the evaporated supercooled droplet deposits onto the ice crystals thereby, along with the remaining supercooled droplets freezing on impact, allowing the ice crystals to grow.
Drawing representing the Bergeron-Findeisen process: Ice crystals growing at the expense of water droplets
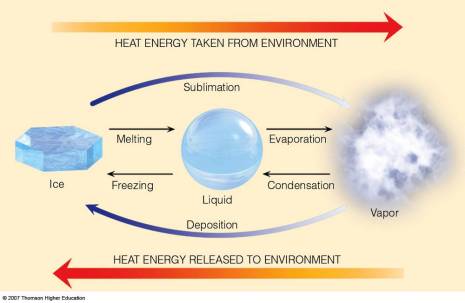
The freezing processes gives off heat, warming the surrounding environment.
This warmer air rises, cools, and creates small circulations where downward (subsiding) air compensates for the locally rising air where the ice crystals are growing. The subsiding air warms, creating the hole.
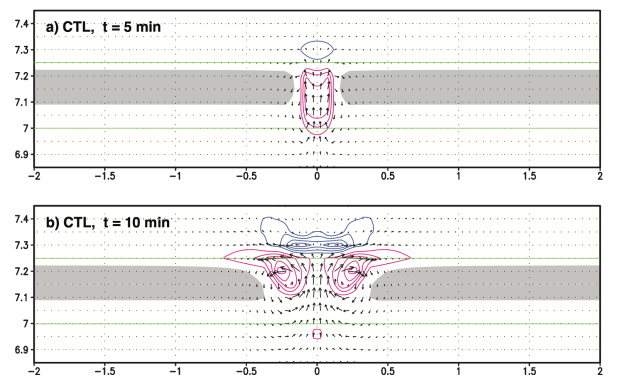
Computer simulations of a hole punch cloud showing heating (red), cooling (blue), and the corresponding circulations (black arrows). From Muraki et al. (2015).
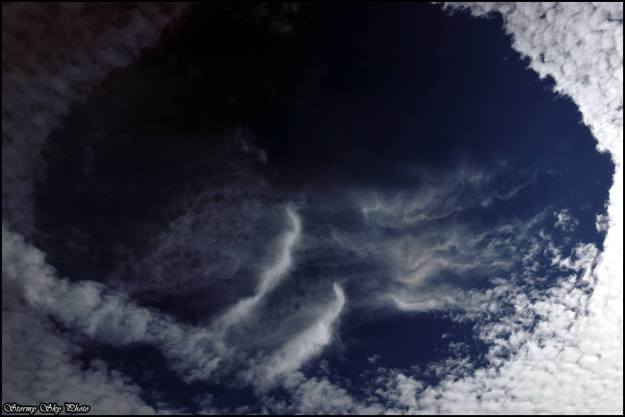
Zoomed in view of the hole punch cloud showing the fall streaks (Karl Kischel, Missouri, 18 Feb 2016)
On 18 February 2016, Karl was lucky enough to photograph two of these hole punch clouds over Williamsburg, Missouri.
Two fallstreak holes, Karl Kischel, Williamsburg, Missouri
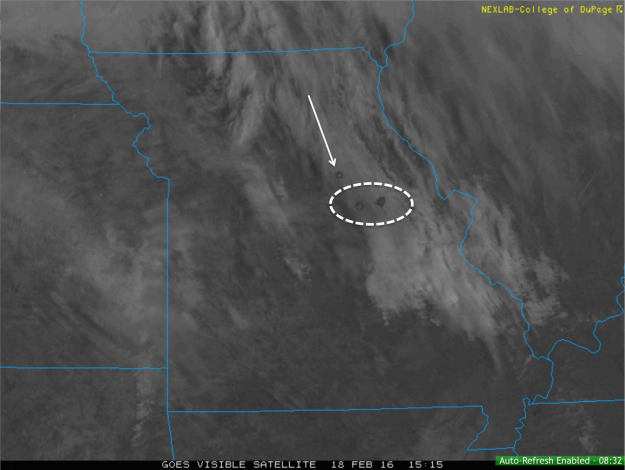
These fallstreak holes could also be seen on visible satellite imagery! Those in the circle are the same ones Karl was photographing. Notice there’s a third one nearby. In fact, because these are visible from satellites, scientists have used high-resolution satellite data to look at the occurrence of fallstreak holes around major airports in the U.S. They found that they occur 3-5% of the time on average per year, and about 15% of the time during the winter (when we’re most likely to see these altocumulus/altostratus cloud layers).
GOES Visible Satellite image from 15:15 UTC on 18 February 2016 showing the fallstreak holes.
Besides wanting to know your chances of seeing these beautiful hole punch clouds in the sky, why is it important to know how often they occur? There’s an argument that the increased snow that falls from the holes could mean more de-icing would be required at the airport before takeoff.
Computer simulation after 60 minutes from when ice was introduced into the cloud layer. From Heymsfield et al. (2011)
Thanks for the great pictures, Karl! Enjoy additional photos he took from that day.
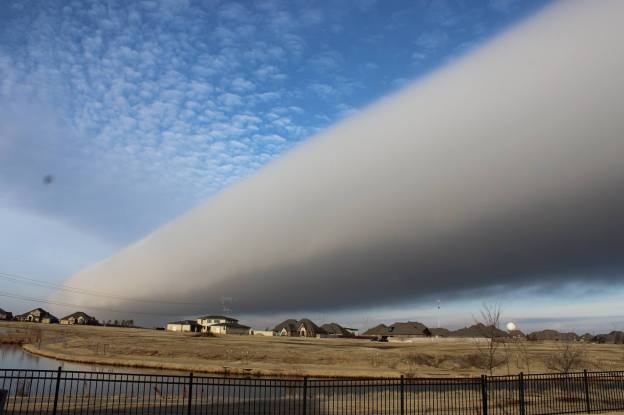
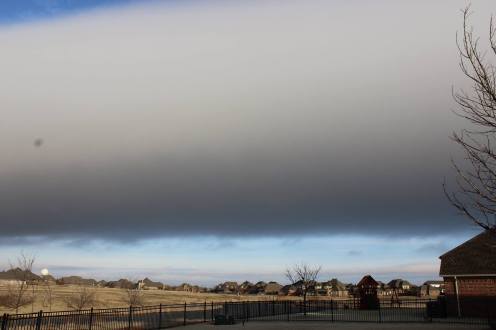
Roll cloud associated with an undular bore over Norman, Oklahoma on 17 January 2016. Credit: Pamela Heinselman
On the morning of 17 January 2016, Pamela Heinselman captured a beautiful sight over Norman, Oklahoma: A long, extensive roll cloud associated with an undular bore.
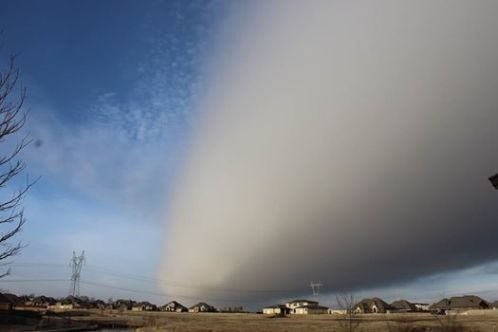
Roll cloud associated with an undular bore over Norman, Oklahoma on 17 January 2016. Credit: Pamela Heinselman
Roll cloud associated with an undular bore over Norman, Oklahoma on 17 January 2016. Credit: Pamela Heinselman
What exactly creates these clouds? An undular bore is a type of gravity wave (meaning gravity is the restoring force) in the atmosphere (particularly the lower levels near the ground) that occurs when a low-level boundary such as outflow from a thunderstorm or a cold front reaches a layer of cold, stable air. This “disturbance” of the air is similar to when you disturb water by throwing a rock in the pond, creating ripples on the water’s surface. The disturbance of the low-level air by the front leads to ripples in the air. If the air is moist, clouds will form where the air is rising along this wave-like disturbance.
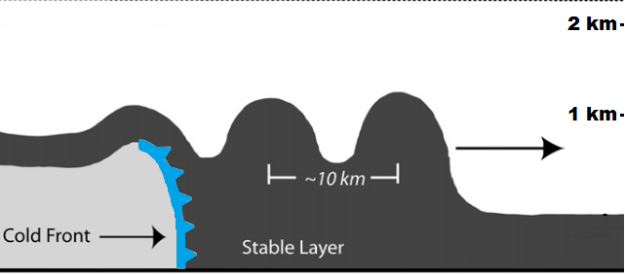
Idealized drawing of an undular bore created by a cold front. From Hartung et al. (2010).
Bores have been described in the scientific literature since as far back as 1950. With advancements in our observational capabilities through ground-based and satellite-borne instruments, the formation, properties, and impact of these bores have been studied in great detail since then. The drawing above is adapted from one of these studies, in which a group of scientists described an undular bore associated with a cold front that moved through Oklahoma in 2006, much like the one photographed by Pamela in this blog. In that study, they showed that there was a strong temperature inversion near the surface in the morning, meaning that temperature increased with height indicating stable air ahead of the cold front.
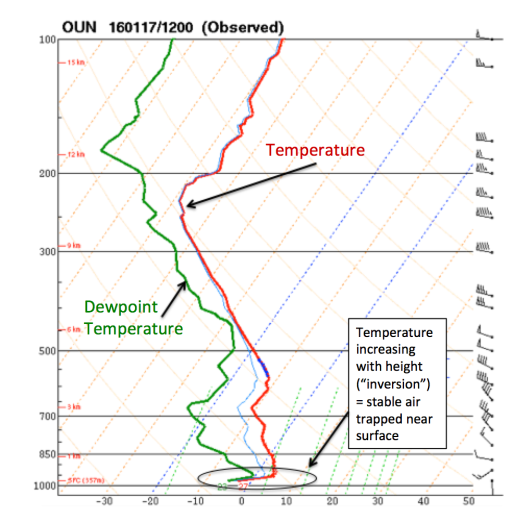
Shown below is data from instruments released on a balloon that tells us how temperature, moisture, winds, and pressure change as you go up in the atmosphere. On the morning of 17 January 2016, not long before Pamela took her photos of the roll cloud, the ballon data showed a strong inversion near the surface with the temperature at the ground below freezing, indicating that the air over Norman, Oklahoma was cold and stable ahead of the cold front.
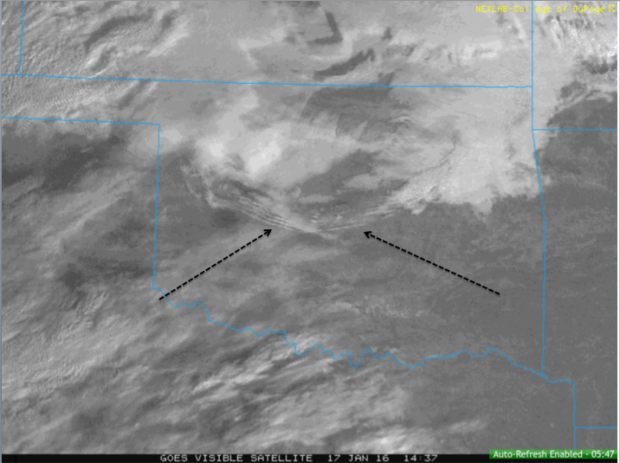
This cool, relatively stable air trapped near the surface was lifted ahead of the advancing cold front. Due to the inversion, that lifting air was trapped, leading to the oscillating, wave-like pattern that resulted in the undular bore seen in the photos over Norman. Not only did this bore show up as a roll cloud in photos by Pamela and others, the roll pattern of clouds associated with the bore showed up in visible satellite imagery, looking like ripples in a pond. Notice how far these clouds extend across Oklahoma!
Visible satellite image at 1437 UTC (8:37 AM) on 17 Jan 2016 showing the undular bore over central Oklahoma
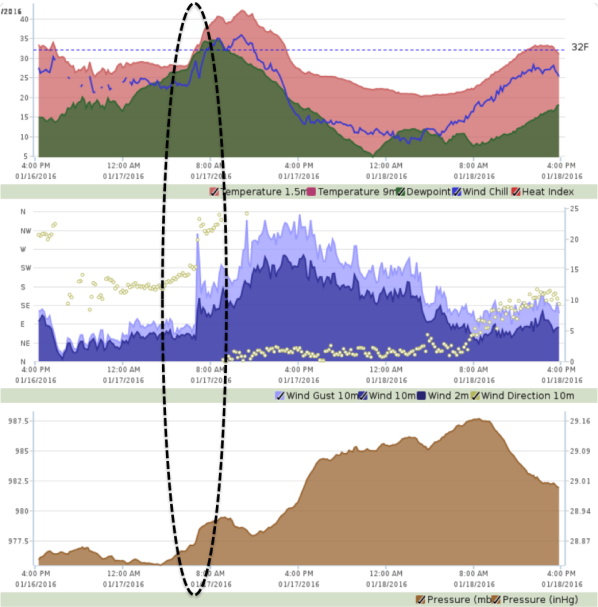
When these bores pass over an area, not only can you visibly see them as beautiful, long rows of clouds, they are also associated with shifts in surface observations, particularly gusty shifting winds and rising pressure. Data from a station at Norman shows a sharp increase in pressure along with a quick increase in wind speed and change in direction around the time these photos were taken! The cold front passed through later in the day, leading to another shift in the winds to northerly and decreases in temperature and moisture.
Surface data from Norman, Oklahoma showing the surface response to the bore.
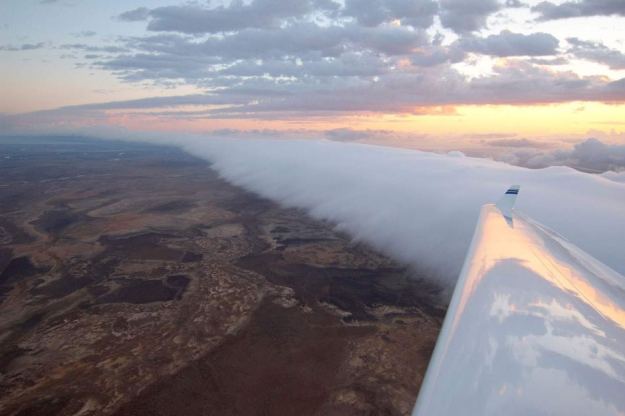
While many studies of bores have occurred in Oklahoma due to many instruments available, they are not unique to this area. Examples from Iowa have shown bores on radar and webcams, as well as examples off the coast of Texas. Perhaps the most well-known example of undular bores throughout the world is a roll-cloud formation in Australia called the Morning Glory.
Triggered by sea breezes near the Gulf of Carpentaria, the length, persistence, and smoothness of this cloud band attracts scientists and gliders (as seen in the photo above) who like to “surf” these atmospheric waves. The Morning Glory Cloud is such a common feature in the Spring in this area that there’s even a festival named after this incredible phenomenon.
Jerry Tangren sent us this picture from Wenatchee, Washington on 26 March 2015 of amazing optical phenomena in the sky.
Jerry Tangren, Wenatchee, Washington, 26 Mar 2015
The 22-degree halo is the most common of these arcs, creating a full circle around the sun. However, the other arcs in this picture are much less common. Here we compare what we see in this picture to a generalized diagram from the incredibly educational Atmospheric Optics page: http://www.atoptics.co.uk.
When we put Jerry’s picture within this context of this diagram, we are able to identify the other arcs as the upper tangent arc and the rare supralateral arc.
Jerry Tangren, Wenatchee, Washington, 26 Mar 2015 (annotated)
We know that these halos and arcs are created by the sunlight being bent through ice crystals. But which optical phenomenon occurs depends on how high the sun is above the horizon, what types of ice crystals are present in the cirrus clouds, and how the crystals are oriented relative to the sun.
For the 22-degree halo, the sunlight passes through hexagonal crystals, bending (refracting) twice as it passes through one face of the crystal and out the other. These crystals act like a prism, separating the light into the colors of the visible spectrum. This circular halo is relatively common because these crystals don’t have to have any particularly orientation for the sunlight to bend this way.
An example of a prism separating the light into the colors of the visible spectrum
Sitting atop the 22-degree halo is the upper tangent arc. Like the halo, this arc requires the sunlight to be bent through hexagonal crystals, but in this case, they must be columnar crystals (compared to plate-like crystals), and have to be oriented with their long axes nearly horizontal.
From http://www.atoptics.co.uk, a diagram showing how the sunlight must be bent through a columnar crystal to form an upper tangent arc (blue) as it’s long axes are oriented horizontally.
Note also that this arc is curved along its edges. The amount of curve depends on how high the sun is above the horizon. It flattens out the higher the sun is in the sky, although the limit to even see this upper tangent arc is about. 29 degrees above the horizon.
An example from http://www.atoptics.co.uk showing the curvature of the upper tangent arc when the sun is at an angle of 20 degrees above the horizon. Above 20 degrees, the arc flattens, while the closer the sun gets to the horizon, the more the arc bends.
Finally in the picture, we have the supralateral arc. This arc also requires columnar crystals, but instead of the sunlight entering the side of the crystal like for the upper tangent arc, it enters through the base of the crystal and out one of the prism faces. The shape of this arc also depends greatly on how close the sun is to the horizon.
So how rare is this? Well, a German group that studies halos did a study to determine how many days out of the year you could expect to see these different phenomena in the skies over Europe. Using 10 years of observations, they determined that the more common 22-degree halo could be seen 100 days out of the year, while the rare supralateral arc was only visible on about 4 days.
From http://www.atoptics.co.uk, the relative frequencies of halo sightings in Europe by the German Halo Research Group.
The next question is, why are the supralateral arcs so rare? It has to do with the quality of the crystals (meaning no impurities along the edges to disrupt the bending of the light), the specific orientation of the crystals required, and how faint they are making them more difficult to see. For more details about the supralateral arc, as well as all atmospheric optical phenomena, check out the incredibly information page: http://www.atoptics.co.uk.
Vog? What is that? Well, fog is tiny suspended droplets in the air, while vog are suspended particulates from volcanoes. This volcanic air pollution casts a hazy scene near the Hawaiian Islands as sulfur dioxide from the volcanoes mix with oxygen and water vapor in the atmosphere to form tiny sulfate particles. These particles can reflect the sunlight, making the extent of vog detectable by satellites, such as in this example from 2008.
While the vog in this example was an extreme case, from the ground, these particulates can create a hazy view. This picture was taken by Stephen Green on a plane near the Kona airport on the Big Island of Hawaii, showing an example of the haze.
Stephen Green (Imaginscape Photography), Kona, Hawaii, 1 Apr 2015
Notice how the haze is trapped in a shallow layer near the ground. This happens because of what’s called an inversion, where the temperature increases with height instead of typical decreasing. This “trade inversion” provides a cap to the vertical growth of clouds, which is why the cumulus clouds in this photo remain shallow in this layer. This stable scenario forms when winds are weak, so the vog persists in this shallow layer of stagnant air near the surface. Balloons launched twice a day from locations around the U.S., including Hawaii, carry instruments into the atmosphere that measure the vertical profile of temperature, moisture, pressure, and winds. An example of these measurements from Hilo, on the day this photo was taken (1 April 2015), shows the existence of this temperature inversion, with dry air above it and moist, relatively calm conditions below.
A study by Guanxia et al. [Guangxia Cao, Thomas W. Giambelluca, Duane E. Stevens, and Thomas A. Schroeder, 2007: Inversion Variability in the Hawaiian Trade Wind Regime. J. Climate, 20, 1145–1160. http://journals.ametsoc.org/doi/full/10.1175/JCLI4033.1] used these observations from Hilo and from another location on the island to determine how often this trade wind inversion occurred. They found that the inversion occurs approximately 82% of the time at each station. The following figure from their paper also shows the height and strength (determined by temperature) of the inversion varies based on time of the year.
Annual cycles of the (a) inversion base height and (b) inversion strength at Hilo and Līhu‘e, Hawai‘i, based on data from 1979–2003. (Figure 6 from Guangxia et al. 2007)
Here is another picture from Stephen of an obstructed view of the sky due to vog. In this example, haze from the Pu’u O’o eruption limited the view of lenticular clouds near Mauna Kea on the big island on 8 February 2015.
Stephen Green (Imaginscape Photography), Hawaii, Feb 2015
These inversions aren’t present all of the time as weather systems can move through and eliminate the stable layer, provide moisture, and remove the vog particulates. In these cases, the view on the big island is clearly stunning.
Stephen Green (Imaginscape Photography), Hawaii, March 2015
The upside to this inversion is that the vog and clouds are trapped in the lower part of the atmosphere, leaving a crystal clear view of the sky above. The Mauna Kea observatory is truly a sight to behold and we’ve had the fortune to gaze at the stars from that location on one of these clear nights.
Check out more of Stephen’s pictures on his Facebook page: https://www.facebook.com/stephengreenimages?fref=ts
When thinking of the ocean, we visualize the beautiful waves. Wind in the lower atmosphere moves over the water below, creating waves that build and break along the shore.
Photo courtesy of the Bureau of Ocean Energy Management
This is a familiar example of fluids (both the ocean and the atmosphere) with two different densities moving relative to one another, with the waves being created along the interface between these two fluid layers. This isn’t the only place, though, where these breaking waves can be seen. Take for example this recent picture from Jan Todo Russell over Seattle, Washington. Notice the similarity to the breaking ocean wave?
Jan Todo Russell, Seattle, Washington, 26 Mar 2015
This wave pattern in the clouds, similar to that on the ocean surface, is due to Kelvin-Helmholtz instability, named after Lord Kelvin and Hermann von Helmholtz. In order to understand this instability, consider two layers with different densities on top of each other. The lighter (less dense) layer sits atop the heavier layer (think of the way less dense oil sits atop water). Not only do these layers have different densities, but they are also moving at different speeds. This leads to what is called “velocity shear” across the interface between the two fluids.
Because of the higher velocities in the layer above, a small disturbance can form along the interface of the two fluids. The higher velocity air can, in a sense, grab the lower velocity/denser air below, allowing these disturbances to grow and eventually breaking over like an ocean wave crashing ashore. This ultimate causes turbulent mixing of the two layers, which is a more stable scenario than the separated layers previously observed.
This instability has been studied many times in computer-based and laboratory experiments. Equations have been derived to describe this instability and to determine the necessary conditions (the thresholds) for this instability to occur. Applying these equations in numerical simulations on computers allows for these waves to be produced and studied, such as in this example from the Hrenya Research Group at the University of Colorado, who describe this instability as “An aesthetically pleasing unstable behavior seen in traditional fluids.”
In addition, lab experiments have been set up where this shear zone is established between two layers of different densities. By tilting these fluids, the upper-most, light fluid flows faster, eventually leading to this KH instability and creating the waves, such as in this video from the Department of Applied Mathematics and Theoretical Physics (DAMTP) of the University of Cambridge.
So what does this have to do with the atmosphere? Well, you can have vertical layers in the atmosphere with different densities, where the upper layer has faster wind speeds. This can lead to disturbances atop cloud layers, that lead to this instability and create Kelvin-Helmholtz wave clouds in the sky. Here are a few more dramatic examples from our Community Cloud Atlas.
Brenda Dolan, Colorado
Scott Ellis, Colorado
This instability isn’t unique to our atmosphere and oceans. This instability is out of this world with this wave pattern viewed along the edges of the magnetospheres of planets, including our own Earth and Mercury (see below), as well as in the vicinity of the Red Spot of Jupiter! Nature is amazing!
Great Red Spot on Jupiter (courtesy of NASA)
A figure from the published 2013 article in Nature Communications titled Dawn–dusk asymmetry in the Kelvin–Helmholtz instability at Mercury (Jan Paral and Robert Rankin): doi:10.1038/ncomms2676. The colors show the ion density of Mercury’s magnetosphere, where you can see the KH waves along the edge due to the solar wind.
In our last blog post (https://communitycloudatlas.wordpress.com/2015/04/03/kicking-off-a-stormy-u-s-spring/), we shared some photos from the stormy start of the severe weather season in the central U.S. (24 March 2015). Large cumulonimbus grew over portions of Oklahoma, Arkansas, and Missouri, producing large hail in some locations. On the next day (25 March 2015), another round of severe weather would bring the first reports of tornadoes for the year.
There has already been an excellent summary created for this event that describes the atmospheric conditions and storm timeline: http://www.ustornadoes.com/2015/03/27/the-science-behind-the-oklahoma-and-arkansas-tornadoes-of-march-25-2015/
Earlier in the day, before the storms formed, mammatus clouds were observed over the National Weather Center in Norman, Oklahoma. Dena Grose shared with us her excellent photo, showing these bulbous clouds that can form when the air is much drier below the cloud deck.
Dena Grose, Norman, Oklahoma, 25 March 2015 (2 PM CDT)
While there were severe storms later in the day, these mammatus were not associated with any storms. This is confirmed by looking at the corresponding radar image from this time.
As time went on, a cold front provided the necessary lift to produce storms later in the evening. Matt Wing shared with us a picture of mammatus clouds, this time over Tulsa just prior to when a tornado warning was issued. In this case, the mammatus were indeed associated with severe storms.
Matt Wing, Tulsa, OK, 25 Mar 2015
Post-storm damage surveys indicated several tornadoes that moved through the Tulsa area. The strongest tornado was an EF-2 reported in nearby Sand Springs. Here’s a summary of the damage survey from the National Weather Service.
While Oklahoma experienced the worst of these storms, this unsettled weather provided beautiful views of turbulent skies over nearby regions. Shauna West sent us this picture from Pittsburg, Kansas.
Shauna West, Pittsburg, Kansas, 25 Mar 2015
Further south, over Arlington, Texas, Whitney Coker Terrell shared her turbulent view beneath a storm that same evening.
Whitney Coker Terrell, Arlington, Texas, 25 Mar 2015
Spring in the northern hemisphere means severe weather for much of the U.S. While this year was off to a slow start in terms of tornado reports, there were several days of severe weather reported last week. During this time of year, the necessary ingredients for severe storms come together in the central and southern part of the U.S. These ingredients include warm moist air from the Gulf of Mexico, which are commonly separated from the warm dry air from the southwest U.S. by what we call a dry line. This boundary can be seen on radar as a thin line and can be identified on surface observations by looking at where the warm moist air from the south/southeast is separated from the warm dry air coming from the southwest. Here is an example of the dry line from March 24, 2015; the first day of active weather last week. You can see the faint blue line in the radar image as well as a computer-generated yellow line on the surface map that indicates the dry line. Notice that temperatures are similar (in the 70s and 80s) on either side of the line, while to the west of the line, dewpoint temperatures (a measure of the amount of moisture in the air) are in the 20s and 30s, while 60+ degree Fahrenheit dewpoints to the east of the line indicate moist air. Surface air ahead of the dry line may be warm and moist, but cooler, drier air above that usually comes from the west, forming what is called a “cap.” This means that the warm air is limited in how far it can lift so something needs to push the air upward above that cap so it can reach its level of condensation. At that point, it can tap into the energy available and grow into an impressive thunderstorm. Balloons are launched twice a day, sometimes more if severe weather is expected. These balloons measure temperature, moisture, wind, and pressure. Here is an example of the data from one of these “soundings” from southwest Missouri during a time before the dry line passed through. The lift that’s needed to break through this cap can come from the dry line. That’s why you typically see storms developing along this boundary. Storms that develop along the boundary can displace the air above it, creating what are called gravity waves. This is similar to the way that ripples disperse from the spot on the water surface where you throw a rock. In the sky, the air wants to go up, but if the air is stable (as it is out ahead of the dry line in certain layers of the atmosphere), gravity will pull the air back toward the ground, creating ripples in the sky. Where the air is rising, assuming it’s moist enough, clouds will form. On this day that we’re discussing (March 24, 2015), Karl Kischel noticed some of these gravity wave clouds over Cuba, Missouri at around 3:30 PM CDT.
Karl Kischel, Cuba, Missouri, 24 Mar 2015, 330 PM (CDT)
Because Karl gave us the exact time and location, we were able to go back and look at the corresponding satellite imagery, where you can clearly see the extent of these clouds. The infrared satellite image gives us a sense of the temperature of the cloud tops, where the warmer colors mean warm temperatures and therefore at lower levels. Notice how these wave clouds are lower in the atmosphere than the deep thunderstorms that create the waves downstream. Storms continue to fire off this dry line as it moved eastward. Radar imagery shows this line of storms along the boundary, extending from Missouri down into Oklahoma and Arkansas. Matt Wing was with friends in Huntsville, Arkansas and captured an incredible view of one of these storms. This picture showcases the characteristic anvil of the beautiful cumulonimbus cloud.
Matt Wing, Huntsville, Arkansas, 24 Mar 2015
The bubbly characteristic of the middle of the storm indicates turrets of upward motion. The upward motion in these storms can be strong enough to support increasingly larger ice that can fall as hail. Indeed, storm reports on this day showed hail with diameters reaching 1-2″. As the sun was setting, David Holland was in Oklahoma City, looking at distant storms to the east.
David Holland, Oklahoma City, 24 Mar 2015
He captured the beautiful cumulonimbus in the distance, with a curious section of cloud above the anvil. We suspect this is an overshooting top that has eroded with time. An overshooting top is a cloud directly above the updraft that penetrates through the stable layer where the anvil is seen. When the sun is shining at a low angle (like at sunset), the visible satellite can pick up on these overshooting tops, as is pointed out in this image.