Category Archives: Altostratus

Fallstreak holes over Missouri

FallstreakHole_KarlKischel_Williamsburg_Missouri_USA_18Feb2016_7

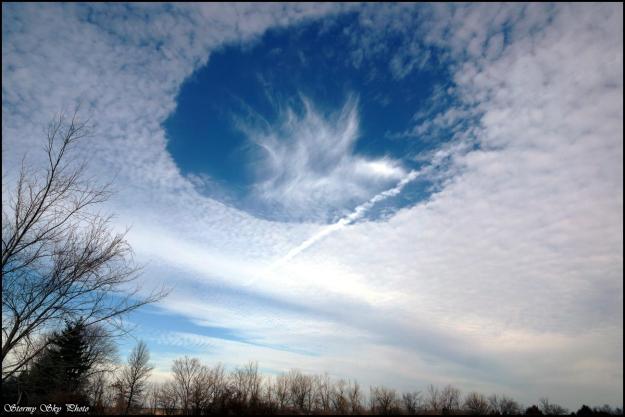
Fallstreak Hole, Contrail, Altostratus (Karl Kischel, Williamsburg, Missouri, 18 Feb 2016)

Hole punch clouds have fascinated sky watchers, scientists, and pilots since the 1940s. Nearly circular in appearance, the hole punch cloud can have streams of ice falling from its center (as in Karl’s picture), thereby giving a subset of these clouds the name fallstreak holes. These beautiful, fascinating atmospheric phenomena are created by aircraft penetrating cloud layer. In Williamsburg, it’s not unlikely to see planes ascending and descending due to the nearby busy St. Louis airport.

Fallstreak holes require a specific cloud type: mid-level altostratus or altocumulus clouds that exist between 6,500 and 20,000 ft above ground. At these altitudes, temperatures are well below freezing, but water droplets exist in liquid form at these sub-freezing temperatures, called supercooled water. To freeze, liquid water droplets need either a nucleus to freeze upon (either ice itself or a particle in the air such as dust, bacteria, fungal spores, volcanic ask, etc.) or temperatures to be below -40 degrees C to freeze spontaneously without a nucleus.

So how does an aircraft flying through supercooled water lead to freezing of drops and ultimately a fallstreak hole?  We know that when aircraft fly high in the sky, at very cold temperatures (i.e., below -40 degree C), the water vapor in the jet engine exhaust rapidly freezes to form contrails across the sky, as can be seen in the photo above. But the key for fallstreak holes is the localized cooling that’s created around propellors and wings. Propellors push air outwards, causing the air to expand, which lowers the pressure and therefore cools the air. For jets, lower pressure exists above the wing compare to below, again leading to localized cooling of the air. This can cool the air to temperatures below -40 degree C, even when the aircraft is flying at lower temperatures, causing the supercooled water droplets in the cloud layer to spontaneously freeze where the aircraft passes through.

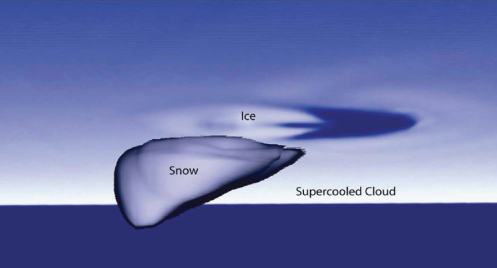
These ice crystals begin to grow at the expense of the nearby supercooled droplets, referred to as the Bergeron-Findeisen process. The vapor left behind by the evaporated supercooled droplet deposits onto the ice crystals thereby, along with the remaining supercooled droplets freezing on impact, allowing the ice crystals to grow.

bergeron_s

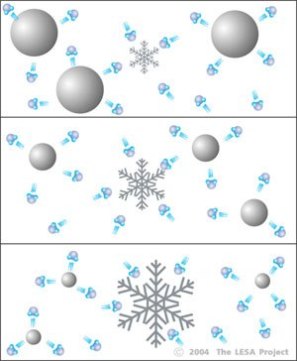
Drawing representing the Bergeron-Findeisen process: Ice crystals growing at the expense of water droplets


The freezing processes gives off heat, warming the surrounding environment.

latent_heat_schem


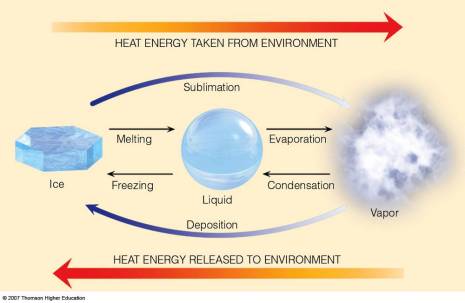
This warmer air rises, cools, and creates small circulations where downward (subsiding) air compensates for the locally rising air where the ice crystals are growing. The subsiding air warms, creating the hole.

Screen Shot 2016-02-21 at 8.08.06 PM

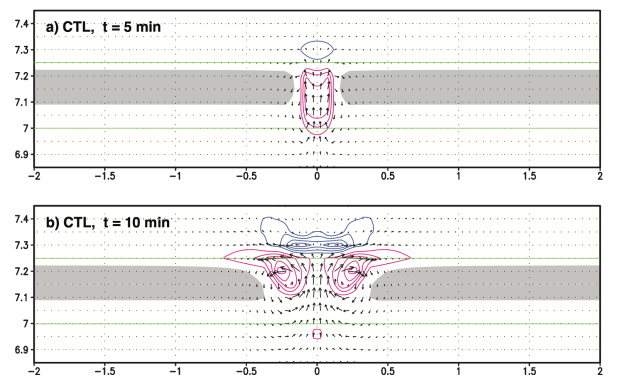
Computer simulations of a hole punch cloud showing heating (red), cooling (blue), and the corresponding circulations (black arrows). From Muraki et al. (2015).


These holes can spread for hours, lasting more than 4 hours at times, and the ice crystals can grow so large that they start to fall as snow, leading to the name fallstreak hole.

FallstreakHole_KarlKischel_Williamsburg_Missouri_USA_18Feb2016_3

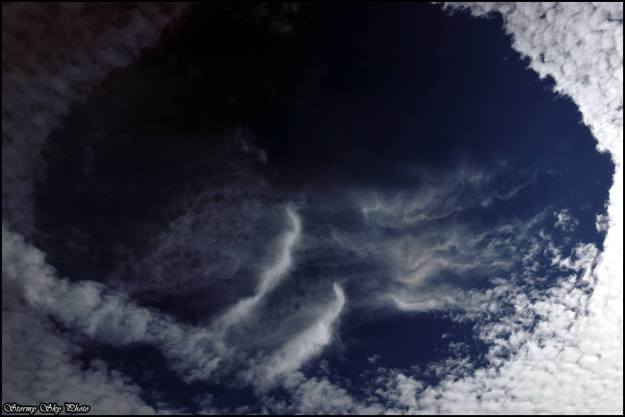
Zoomed in view of the hole punch cloud showing the fall streaks (Karl Kischel, Missouri, 18 Feb 2016)


On 18 February 2016, Karl was lucky enough to photograph two of these hole punch clouds over Williamsburg, Missouri.

FallstreakHole_KarlKischel_Williamsburg_Missouri_USA_18Feb2016_6

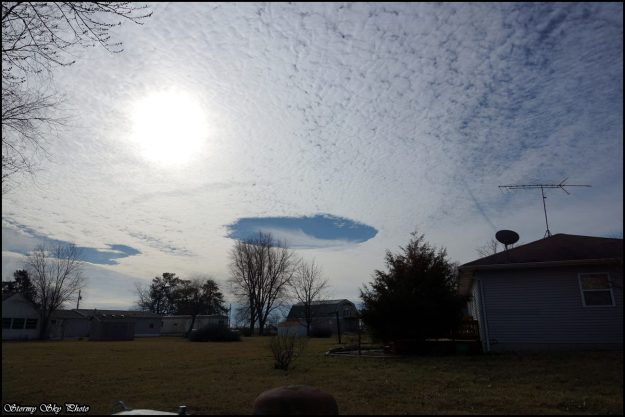
Two fallstreak holes, Karl Kischel, Williamsburg, Missouri


These fallstreak holes could also be seen on visible satellite imagery! Those in the circle are the same ones Karl was photographing. Notice there’s a third one nearby. In fact, because these are visible from satellites, scientists have used high-resolution satellite data to look at the occurrence of fallstreak holes around major airports in the U.S. They found that they occur 3-5% of the time on average per year, and about 15% of the time during the winter (when we’re most likely to see these altocumulus/altostratus cloud layers).

FallstreakHole_KarlKischel_Williamsburg_Missouri_USA_18Feb2016_satellite

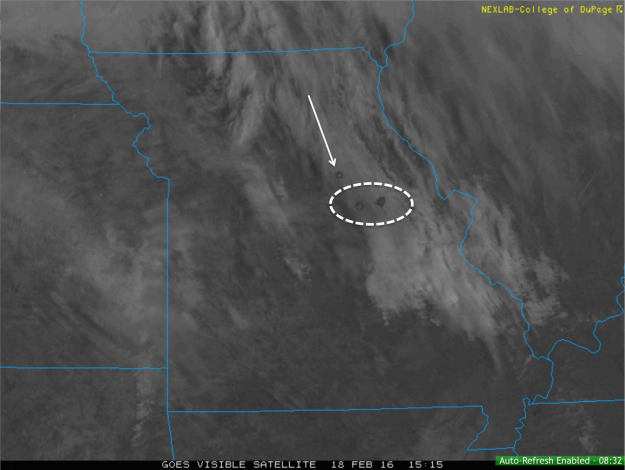
GOES Visible Satellite image from 15:15 UTC on 18 February 2016 showing the fallstreak holes.

Besides wanting to know your chances of seeing these beautiful hole punch clouds in the sky, why is it important to know how often they occur? There’s an argument that the increased snow that falls from the holes could mean more de-icing would be required at the airport before takeoff.

Screen Shot 2016-02-21 at 8.21.42 PM

Computer simulation after 60 minutes from when ice was introduced into the cloud layer. From Heymsfield et al. (2011)


Thanks for the great pictures, Karl! Enjoy additional photos he took from that day.

Incredible Seattle sunset

Last night, Seattleites were treated to a spectacular sunset. I, Angela, was attending the Seattle Sounders game and admit that I was quite distracted by the clouds, as were many others at the stadium. Here was one of the views I had from my seat:
2014-07-13 21.05.00
Angela Rowe
Location: Seattle, Washington
Date: 14 July 2014

What causes these vibrant colors? First, let’s take a look at the visible spectrum. The sun’s rays are made up of a range of wavelengths and therefore colors. The cool colors (blues) are the shorter wavelengths, while the reds are the longer wavelengths.
visible_spectrum

This simple diagram from the National Weather Service online education course (JetStream) shows what happens to the sun’s rays as the sun sets in the sky. At lower angles (B and C), the sun’s rays have to pass through more of the atmosphere, therefore more of the shorter wavelengths are scattered by the air. This leaves the longer wavelengths (the reds and oranges), which can be reflected off of clouds in the mid- and upper-levels of the atmosphere.
Print

While there are many colorful sunsets (and sunrises) in Washington and beyond, the conditions last night were particularly conducive for a colorful show due to the mid-level clouds present over much of the area. Earlier in the evening, water vapor satellite imagery showed an upper-level low pressure system sitting off the coast, spinning counter-clockwise and pumping moisture into the area, seen as the pink colors in this image.

Screen Shot 2014-07-14 at 2.32.09 PM

This moisture was primarily concentrated in the mid-levels, as could be seen as a thickening altostratus layer covered the sun over the city. Note there are some darker clouds underneath as moisture continued to move in from the southwest.
2014-07-13 18.45.53

Showers and thunderstorms were prominent to the south, especially over northern Oregon, but the lower levels over Seattle and much of NW Washington remained dry. Every day, twice a day, the National Weather Service launches instruments on balloons called radiosondes that measure the temperature, moisture, pressure, and winds as the balloon ascends into the sky. Here is an example of what this balloon data looked like last evening around this time, with the red line indicating temperature and the blue dewpoint. The dewpoint is the temperature at which the air would have to be for saturation to occur. The higher the number, the more moisture in the air. Where the dewpoint and temperature are far apart indicates dry conditions (low humidity), while areas where they are nearly the same are where you might expect clouds. So, if you look at this example, you’ll see that most of the atmosphere near Seattle was very dry, with the exception of right near the surface and in between pressure levels of 400 and 350 mb. This corresponds to heights above the surface between roughly 7.5 and 9 km, where many of the clouds were observed on this particular evening.
2014071400_uil

So as I entered the stadium around this time, I quickly became distracted by the mammatus clouds that were forming overhead. The dry air below the moist levels helped create these brief, but beautiful bulbous clouds and it became increasingly difficult to pay attention to the game.

2014-07-13 19.56.03 2014-07-13 19.59.54

In order to keep track of what was going on around the stadium, I kept an eye on the radar. Some of the showers from the south looked like they were making their way toward Seattle, as can be seen in this radar image during the game.
20140714_030559_black

At the stadium itself though, some light drizzle could be seen, but overall the rain was evaporating before reaching the ground. This is referred to as virga and can be seen in these pictures that I took from the stadium around this time.
2014-07-13 20.52.31 2014-07-13 20.53.15

So as you might have guessed, I was quite distracted by the sky throughout the game. The Sounders ended up beating Portland in an exciting 2-0 game, but I bet a large portion of the 64,000+ fans at the stadium were also paying attention to the sky. In fact, social media sites exploded with pictures of this fiery sunset, from the stadium and throughout other areas near the Puget Sound (http://blogs.seattletimes.com/today/2014/07/sunday-nights-seattle-sunset-captured-on-twitter/).

Later on at night, lightning flashed in the distance as storms persisted over the southern Olympic Peninsula. The low was moving onshore, bringing with it cold air aloft that created an unstable environment, in addition to the moisture available, to maintain these storms. Living in a place like this, where there aren’t a lot of thunderstorms, I’ll certainly take what I can get.
20140714_062632_black

This morning, I was curious to see how much rain did end up reaching the ground across the area last night. The CoCoRaHS network (www.cocorahs.org) is a volunteer organization where people report rain at their house. This map shows the reports for the 24-hours ending this morning, with most locations near Seattle receiving less than one-hundredth of an inch!
Screen Shot 2014-07-14 at 2.02.13 PM

And finally, for your viewing pleasure, here’s a link to time lapse video of the clouds and sunset as viewed looking west from the University of Washington’s Atmospheric Science building rooftop. Can you see the different cloud layers before the colorful finish to the day? Click here to see this time-lapse video!

Beautiful mix of clouds in Norway

Cirrus_Altocumulus_Altostratus_Cumulus_CrepuscularRays_HannePernilleRyel_BjornemyrNorway_27Jun2014

Hanne Pernille Ryel
Location: Bjørnemyr, Norway
Date: 27 June 2014

Wow, what a mix of clouds over Norway in this picture! At the highest levels, cirrus clouds smear the sky as the wind carries the ice crystals, while mid-level altocumulus clouds spread out across the sky with their darker appearance creating a great contrast against the cumulus clouds being illuminated by the setting sun. These clouds block the sun to create upward-directed crepuscular rays! Crepuscular means “referring to twilight”, which is appropriate as it forms in the waning daylight hours over Norway. This mixture of clouds indicates moisture at many levels and if, especially, the mid-level cloud layer continues to increase in coverage across the sky, it could mean more inclement weather in store.

Altostratus clouds are a mid-level cloud layer that look like a blue-gray sheet across the sky. The sun can shine through, such as in this picture, giving them the name Altostratus translucidus. They typically form as a stable air mass is gently lifted, which tends to happen ahead of a front. This is common along the West Coast (as in this picture from Washington) where frontal systems frequently move onshore from the Pacific Ocean creating widespread, light rain during the fall, winter, and spring months.

Angela Rowe
Location: Bellingham Bay, Washington
Date: October 2012

Altostratus_AngelaRowe_BellinghamBayWA_Oct2012