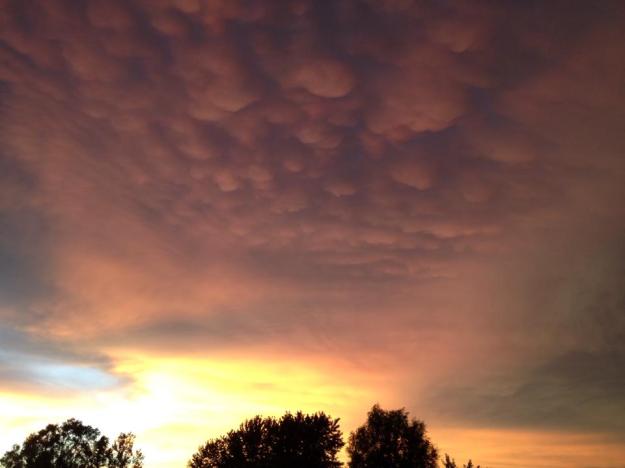
“Well that looks ominous” said Meredith O’Neill Muminovic as she took this photo of an approaching storm on 26 April 2016 in St. Louis, Missouri. The shelf-like appearance of the storm’s leading edge indicates strong winds as rain-cooled air lifts warmer, moist air out ahead of it. At the time of this photo, a Severe Thunderstorm Warning was in effect as 60+ mph winds were reported in the area, as well as hail 1″ in diameter covering the ground in some locations.

Shelf Cloud, Meredith O’Neill Muminovic, St. Louis, Missouri 26 Apr 2016
The corresponding radar image from around this time shows that the storm Meredith photographed was part of a line of storms moving across Missouri, referred to as a squall line. The red and orange areas in radar reflectivity indicate the heaviest rain, with weaker but widespread rainfall following behind the leading edge. The yellow box around St. Louis indicates the area under the Severe Thunderstorm Warning, which is aligned where the squall line appears bowed.

Radar Reflectivity, St. Louis, Missouri, 26 Apr 2016 2:07 PM CDT
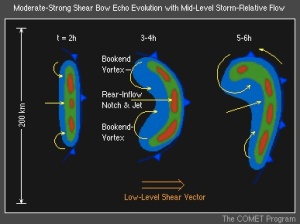
The bow echo is commonly associated with strong, often damaging winds at the surface. Much research has gone into studying bow echoes, leading us to understand how they form and the resulting weather they cause. The bow structure is strongly related to the wind shear of the environment these storms form in, meaning how the winds change direction and speed with height.
Underneath the storm, turbulent motions are also present, as nicely captured by this video by Billy Reed in St. Louis around the time of Meredith’s photo.
Above, the clouds are deep and, individually, take on the classic structure of a cumulonimbus. In this schematic from the National Weather Service’s online school, JetStream, you can see that where the radar reflectivity shows the heaviest rain with the reds and oranges, the cloud is deep. Warm, moist air flows into the storm from out ahead of the squall line, fueling the strong updraft which hits a stable layer aloft, usually the tropopause, and creating an overshooting top. Within those strong updrafts, large hail can grow as supercooled liquid water freezes upon ice. Smaller Ice crystals can be carried outward to form the anvil of the cumulonimbus or fall and melt behind the updraft, contributing to the heavy rainfall at the surface and lighter rain extending behind the main leading line.

Schematic showing a vertical cross section of the cloud, precipitation, and air motion associated with the radar image of a squall line (from National Weather Service)
The rain cools the air near the surface relative to the surrounding environment. This rain-cooled air rapidly moves outward away from the rainy core. The leading edge of this dense, cool air is referred to as a gust front.

Labeled schematic of a squall line storm from University of Illinois Urbana-Champaign
Warm, moist air that’s flowing in towards the storm is lifted up and over this denser, colder air along the gust front, leading to new cloud formation, and sometimes the shelf cloud that extends outward from the main line of storms, as was shown in Meredith’s picture above.
This multi-cell nature that allows these storms to persist can be seen in this photo from western Oklahoma on this day, when Jack Christian also had his eyes to the sky. The anvil of this series of this multicellular storm over northern Texas extended far across the Plains, with newer cumulus congestus clouds forming in its vicinity. Notice the tilt in these cumulus congestus clouds, as the strong wind shear indicates increasing winds with height, but turning in direction from the tops of these clouds to the top of the cumulonimbus as the anvil spreads out in the other direction.

Cumulonimbus, Multicell, Jack Christian, Elk City, Oklahoma, 26 Apr 2016 5 PM CDT
So we’ve taken a good look at these storms from below, but what about above? Matt Barto was flying over Oklahoma later that afternoon and was treated to this spectacular view of the storms from above. Look at the classic structure of this cumulonimbus, with the anvil spreading outward from the bubbling core.

Cumulonimbus, Matt Barto, over Oklahoma 26 Apr 2016
We live in the era where 1-min visible satellite data is available and it’s incredibly valuable for looking at the evolution of these storms. Here’s a 30-min loop showing the storms over Oklahoma and Texas where you can see the bubbling nature of the individual clouds, with the overshooting tops clearly visible, the anvils spreading outward, and gravity waves resulting from the displacement of mass in the atmosphere by these massive storms.

GOES 14, 1-min Visible Sector 26 April 2016 2220- 2250 UTC
At the end of the day, not only where there very strong wind reports (blue dots) from the squall lines, but over 30 reports of tornadoes (red) and hundreds of reports of hail (green) including some baseball-sized.

26 April 2016 Severe Reports
Did you experience severe weather this day? We’d like to hear your story and see your cloud photos.